We have created health_stack with the aim of sharing our knowledge and understanding of R code to hopefully benefit researchers in the health and well-being field. When developing this site, we spent a lot of time trying to decide how best to structure the tutorials in a way that makes the most sense. Whilst the way data is processed can vary based upon the use case and even user preference, we have decided that the best way to look at this is from a research perspective (which shouldn’t be surprising as researchers!).
As a result, we have categorised all the tutorials into the following sections:
- health_stack: These are orientation posts and basics both on the site itself and the R software.
- Import: Before you can work on your data within R and R studio, it has to be imported into the software. This section will cover the basics of entering data from common file types.
- Cleaning: Data is only as good as how it has been entered or captured and so most data sets contain errors that need to be removed prior to analyses.
- Transform: If you are lucky, your data will be in the format you need to analyse but most of the time, data requires altering, converting, summing and/or aggregating. These posts will discuss how to do that, related to common health related topics of our research.
- Visualise: Once you have the data in the format you want, it is often best to visualise it to see if it makes sense and is plausible. This step can be cyclical in a sense that when you are dealing with new data or data your need to understand, it might take numerous attempts as cleaning, transforming and then visualising your data before you agree on the final data set.
- Model: After you have the data in the format you need to, you can the model the data using statistics or more advanced modelling techniques such as machine learning. This site is not intended to be a statistics page, but we will cover the basics of how to accomplish these within R.
- Communicate: After you have visualised and modelled your data, another important step is how to export or host the data you have worked on in R. This category will show you how export objects and in the future, will outline how to create more advanced communication tools such as apps and your own blogs.
- Program: Most of the posts from the above categories will be completed in isolation, but as you become more familiar with coding, most of the actions can be automated and code can be reused. This becomes really helpful when you have multiple files that you would like to process in the same way. This category doesn’t really fit in a linear cycle but more as a separate way of thinking about how to process your data.
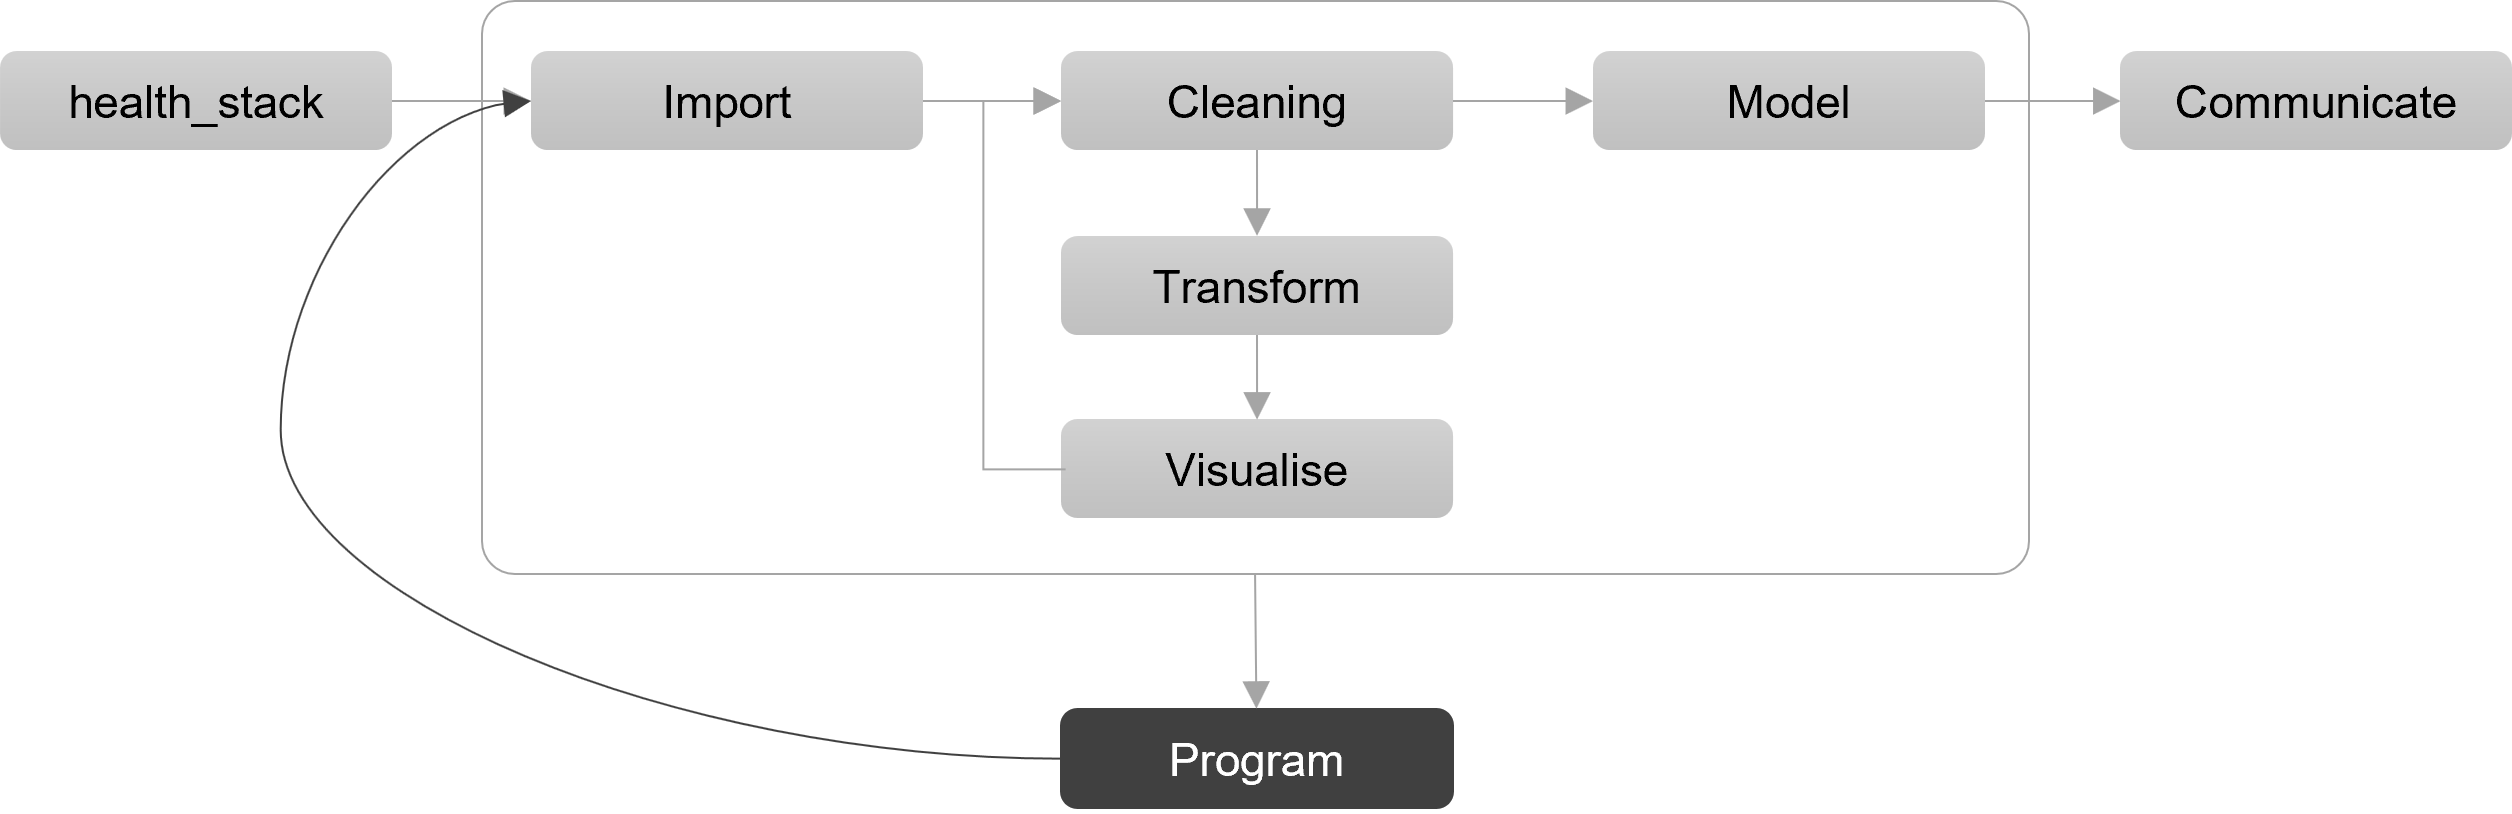
For those that think visually, the image above represents all the sections of the site. As we have said before, this is just one way of looking at data science, but one we hope you will find useful.
When you click on the tag buttons at the top of the tutorials page, you will be able to cycle back and forth through each category.
We want each section to be independent and not reliant on the last. BUT… this doesn’t mean that there won’t be some assumed knowledge when we cover the more advanced topics.
We have lots of topics in mind but if you have any suggestions then please get in touch using the Contact page, and we would be more than happy to help.
